ALMA is the premier imaging instrument for high radio frequencies. With successful completion of the ALMA Phasing Project (APP), the telescope can also provide a beamformed output that expands the scientific capabilities of the instrument for time-domain science. Apart from enabling mm-VLBI observations, the APP allows us to use ALMA, independently of other observatories, for time-domain observations of point sources, in particular pulsars.
The Phased ALMA Pulsar Modes study has defined pulsar phasing and data modes using the APP and provides software (see below) for resampling and reformatting into PSRFITS format for use in pulsar and transient search and timing pipelines. It built upon the APP system as well as technical developments that provided pulsar data with the phased VLA. The study used data from the APP recorded in VLBI Interchange Format (VDIF) and produced PSRFITS files that can be processed with existing pulsar and transient pipelines developed by some of the proposers. The pipelines require modest but necessary accommodation of the nearly negligible interstellar propagation effects at mm wavelengths in comparison with substantial distortions at cm wavelengths.
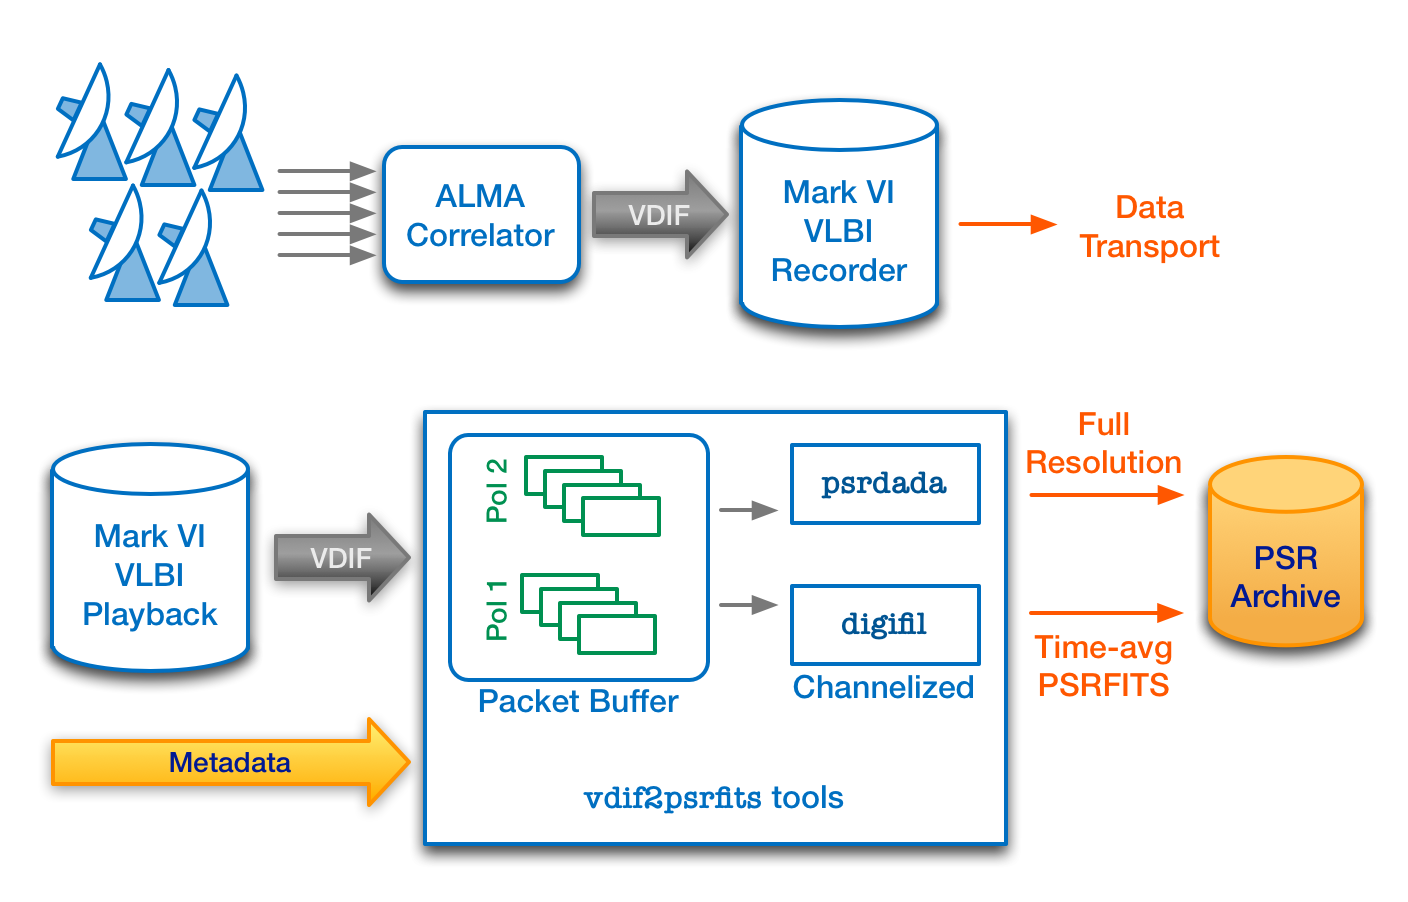
Figure: The flow of data from the ALMA telescopes, through the phased array output from the correlator, to the vdif2psrfits tools that produce PSRFITS data suitable for pulsar and transient pipelines.
Processing Steps
Observing: The first step for getting ALMA pulsar data is to successfully propose for and conduct your phased-array observations. See the ALMA observing guide for details on the observation process. Once the observations have been conducted, the phased-array data will be written to disk. The exact parameters of the data will depend on your particular observing set-up, but in general it will be a few (~GHz wide) channels of raw voltage data written in VLBI Data Interchange Format (VDIF). In order to process the data with standard pulsar software, we need to convert from VDIF to PSRFITS (or SIGPROC) format.
VDIF to PSRFITS: The next step is to take the raw voltage data in VDIF and convert it to channelized and time-averaged data in PSRFITS format using vdif2psrfits (K. Liu, see Software section). This step is important for two reasons. First, PSRFITS is a standard data format in pulsar astronomy and just about any pulsar processing software you may want to use will be able to read it. Second, the small number of large (~GHz wide) frequency channels sampled at very high time resolution (~ns) are not ideal for pulsar observations because they are particularly susceptible to radio frequency interference (RFI). Splitting the data into smaller frequency channels means that less data will be lost due to contamination with narrow-band RFI.
The vdif2psrfits code operates as follows. First, raw voltage data are read from the ALMA data files. In VDIF, data are stored in "frames" containing short segments (e.g., 8 microseconds) of data in a single polarization. Frames from the same time are collected for both polarizations and combined to produce the desired coherence product. Next, the combined data are channelized using an FFT filter bank and time-averaged. The number of frequency channels and the output time resolution are free parameters that can be set by the user. For our test observations, we split each 2 GHz sub-band into 32 64 MHz channels with 8 microsecond samples. Finally, the channelized and time-averaged data are written to file in PSRFITS format.
At this point, the data are stored in PSRFITS as channelized time series of Stokes IQUV (or single pol, if desired) and are ready for analysis with your favorite pulsar processing software. For those new to pulsar observing, we will briefly describe the general steps below.
RFI Flagging: Since pulsar signals can be very faint, we want to remove any RFI signal that could contaminate our results. RFI signals can be narrow-band or broad-band, transient or persistent. It is often too difficult to excise only the RFI signal from the data, so we mostly just mask the segments of the data containing RFI. For example, if we have a narrow-band RFI signal (bandwidth < MHz), we can just mask out the frequency channel containing it. If we have a transient broad-band RFI signal, we can mask out the time samples containing it. Some pulsar processing software packages (e.g., PRESTO) have routines for automatically classifying and masking RFI in a data set.
De-Dispersion: The propagation of radio waves through the cold electron plasma of the interstellar medium produces a frequency dependent time delay called the dispersion delay. The dispersion delay goes as:
t_dm = 4.15 ms (freq / 1GHz)^-2 DM
where the dispersion measure (DM) gives the integrated electron density along the line of sight to the pulsar.
The delays across the ALMA band can be quite small due to the high observing frequencies. For example, the delay between 86 GHz and 100 GHz for a pulsar with DM = 1800 pc/cc is only 0.26 ms. Thus the dispersion delay can be ignored in most cases except when very fine time resolution is needed for large DM objects (e.g., in the Galactic center).
After the frequency channels have been shifted according to the appropriate dispersion delay, the data in all the frequency channels are summed together to produce a 1-dimensional time series. This time series can then be used to search for new periodic signals (or transients) or to fold the data on a known pulsar ephemeris.
Folding / Searching: Given a known pulsar ephemeris, you can fold the time series data (de-dispersed at the known dispersion measure) to produce an average pulse profile. If you don't know the ephemeris of the pulsar, you can blindly search for it. De-disperse over a range of trial dispersion values, generate power spectra from each time series, and search for periodic signals.
VDIF – psrdada – filterbank / archive: This pipeline first converts the VDIF output into PSRDADA format, one of the standard formats used in the pulsar community to store baseband data. The PSRDADA output consecutively attaches two polarizations of the same time stamp, but stores different frequency channels in individual files. It also expands the dynamic range of the original data from 2 to 8 bit. The conversion is done with the vdif2dada routine developed by the Kuo Liu, and the data converted as such can be readily used for beam-forming (if there are any other telescope datasets available) with the software correlator developed for the Large European Array for Pulsars.
Next, the pipeline uses the standard software package dspsr to either reduce the data into filterbank timeseries which are readily usable by the pulsar searching software packages presto and sigproc, or into sub-integration archive data suitable for pulsar timing software PSRChive. The former is done with the routine digifil and the later done with the routine dspsr. The configuration of the output (time resolution, number of channels, length of sub-integrations, etc.) can be specified as options to these two routines.
VDIF – psrfits (search) – archive: This pipeline first converts the VDIF output into search-mode PSRFITS format, one of the standard formats used in the pulsar community. The conversion is done with the vdif2psrfitsALMA routine, developed specifically for this project by Kuo Liu. For each frequency channel, this routine takes the time-series within one storage unit in the VDIF file (commonly referred to as a frame), performs an FFT to go to the frequency-domain, makes detection from voltage to intensity, and collapses the power over the whole FFT spectrum. The detection can be in the form of total intensity, power of a single polarization, or coherence product (easily converted into Stokes parameters) as required.
The PSRFITS output has a basic time resolution of 8 microsecond, and one can give the factor for re-binning. The 32-channel frequency resolution is retained. The output can be directly taken over by Presto to perform pulsar searching, or by psrfits_util software package to fold into sub-integrations.
VDIF to PLSR (vdif2plsr): Each VDIF stream from ALMA contains 2-bit samples for all 32 channels (62.5MHz wide) within one subband and for one polarization. The datastream is divided into frames which each contain 1000 samples for each of the 32 channels (spans 8 microseconds). The first processing step counts the number of samples that occupy each of the four 2-bit states per channel per VDIF frame, and writes (three of the four) counts per packet as well as the VDIF timestamp for each packet to a PLSR file (custom binary format). No output is produced for VDIF frames marked as "invalid" at this stage of the processing.
PLSR to PSRFITS (plsr2fits): This step reads a PLSR file and converts it to a collection of PSRFITS files. The sub-integration data written in PSRFITS format contains average power estimates per channel over each 8 microsecond period spanning a single VDIF frame. The average power estimate is due to a note by Lindy Blackburn, Calculating Total Power from VLBI Data, June 1, 2015; see equation (4) therein. This code is derived from lmt2fits by Michael Johnson et al. There is a limitation on the size of each PSRFITS file so that data for each scan may be spread across multiple files.
Step-by-step example: Assuming all dependencies are met and the attached tarball extracted to $SOME_PATH, the following shows roughly the steps involved to go from VDIF to the PRESTO output shown below:
# VDIF to PLSR

cd $SOME_PATH/vdif2plsr

make pulsar

./pulsar -1 some_vdif.vdif some_plsr.plsr

# add filler data if VDIF contained invalid frames

cd $SOME_PATH/filldata

python filldata.py -o some_filled_plsr.plsr some_plsr.plsr

# PLSR to FITS

cd $SOME_PATH/plsr2fits

make

export YUPPI_DIR=$SOME_PATH/plsr2fits

./plsr2fits -o some_fits -g 1000 -n 32 -w 62.5 -dt 8 -src J0835-4510 -raj 083520.61 -dej -451034.88 some_filled_plsr.plsr

# below are just PRESTO commands, ymmv

prepdata -o some_dat `ls some_fits*.fits`

realfft some_dat.dat

accelsearch some_dat.fft

prepfold -o some_dat -nsub 32 -accelcand X -accelfile some_dat_accelfile some_dat.dat
We received 30 minutes of Test Observations with ALMA on 2017 January 29. The Vela pulsar B0833-45 was chosen as the test target source. The array was phased up on a calibrator and then the phases were held fixed while pointing at the target pulsar, as is typical for VLBI phase-referenced observations. Calibrator scans of 2 minutes each were repeated after 10 minutes on the pulsar, and then again after each 5 minute scan on the pulsar.
After processing the data as described above, we achieved independent detections of Vela with both the pipelines listed above. Sample detections are shown below.
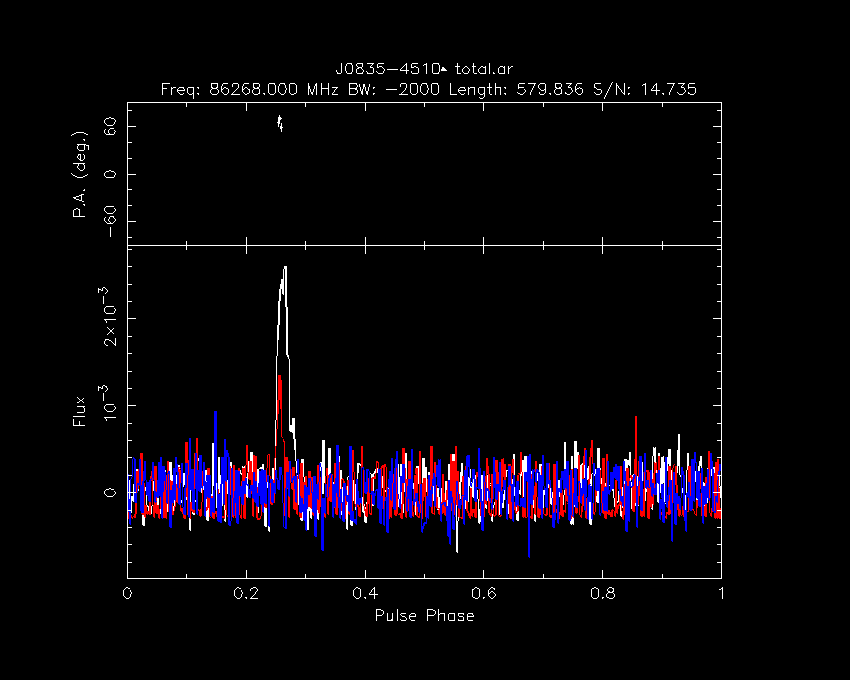
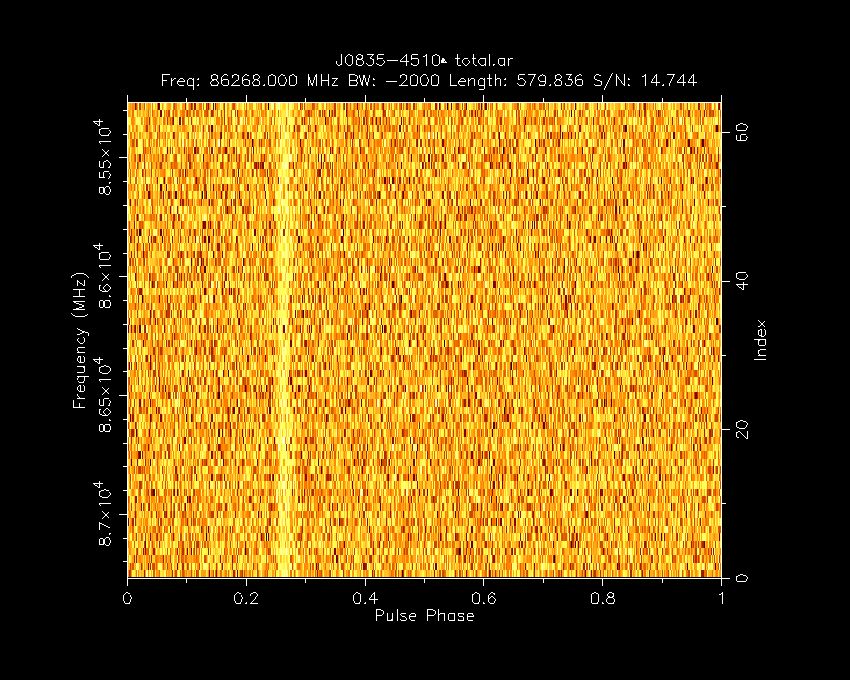
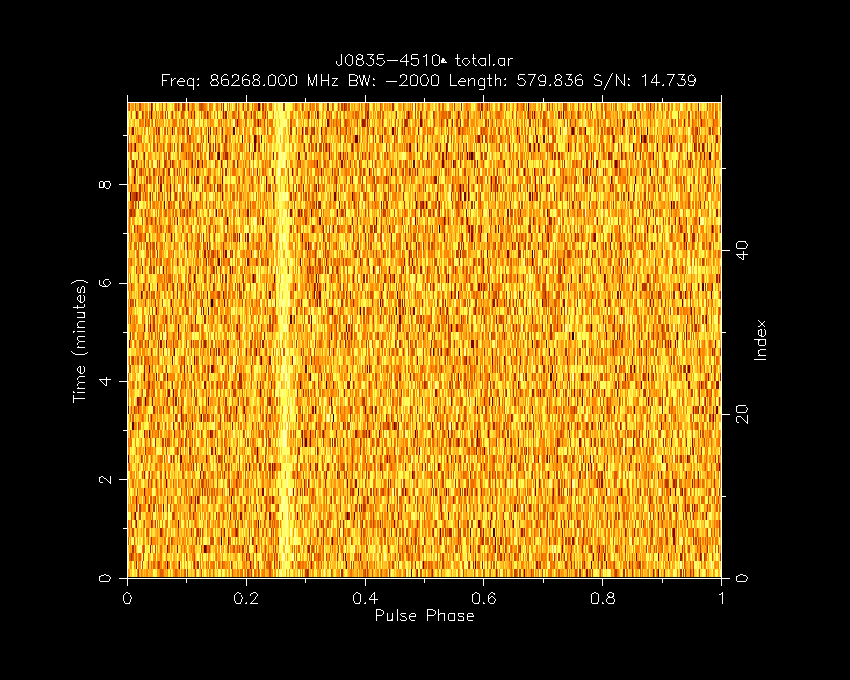
Figure: (1) The Vela pulsar folded pulse profile, as detected in ALMA test observations. The same detection is also shown (2) as a function of pulse phase vs frequency and (3) as a function of pulse phase vs time. Detection via vdif2psrfits.
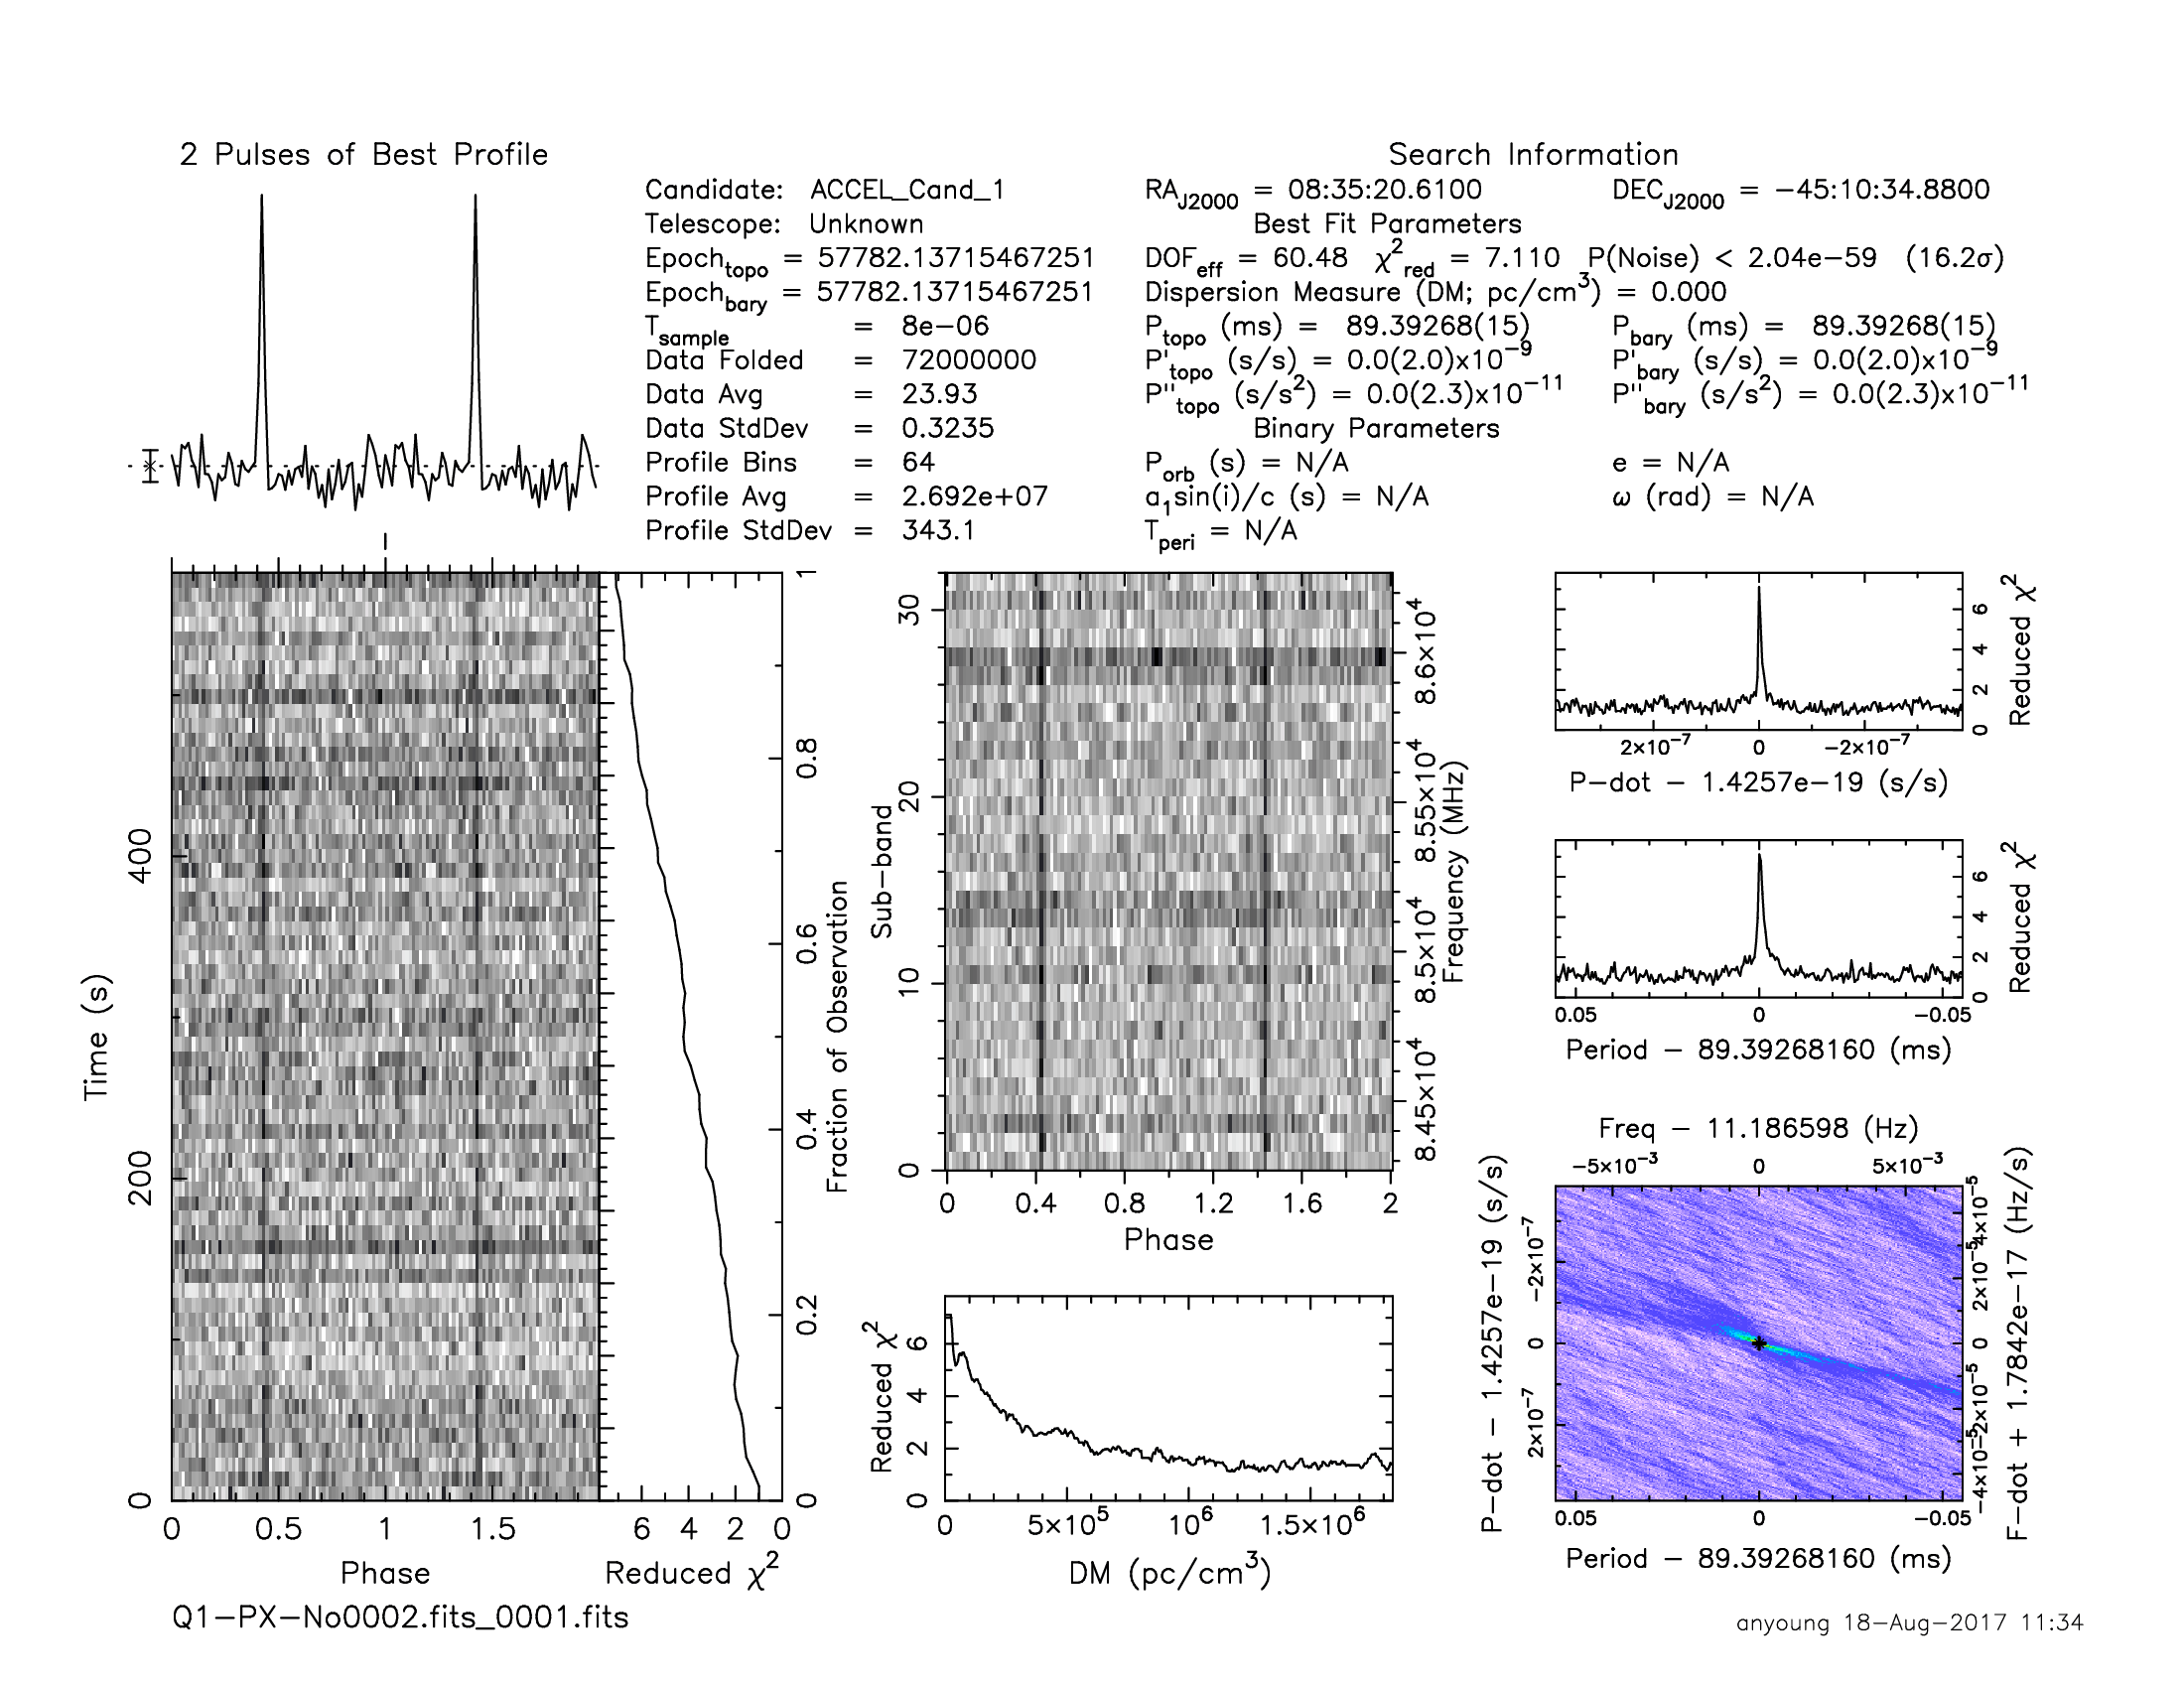
Figure: The Vela pulsar detected in a PRESTO search after processing ALMA data through Vdif-plsr-psrfits.